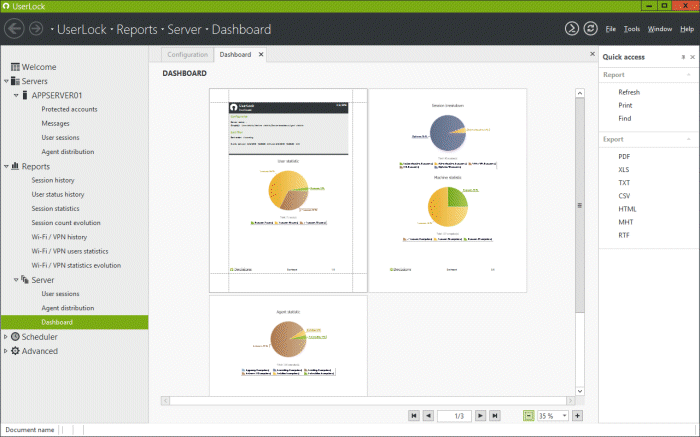
Dashboard
This report displays a printable version of the 'Dashboard' for the specified UserLock server.
'Configuration' section
You can select which graphics you want to include in the report:
-
The User statistic pie chart displays the number of users:
- With no session.
- With one session.
- With more than one session.
-
The Machine statistic pie chart displays the number of computers:
- With no session.
- With one session.
- With more than one session.
-
The Agent statistic pie chart displays the number of machines:
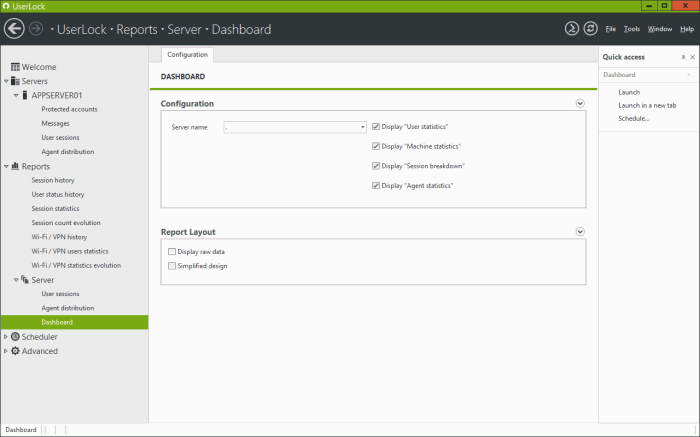
'Report layout' section
Options from this section will adapt the report layout to your needs:
- Display raw data: Report will be displayed as a data grid without any pictures. This layout is adapted for exporting the report to a CSV file type.
- Simplified design: Report will contain the lowest number of pictures possible. This layout is adapted for exporting the report to a 'Microsoft Excel' file type.
Print and export
From the result preview you can decide to print the report or export it to a different format type using actions available in the 'Quick access' panel or the context menu.