Working Hours By Week and By Month
These reports enable you to get a detailed overview of the hours worked by users on your network, for a specific week or month. The reports consist of two distinct parts:
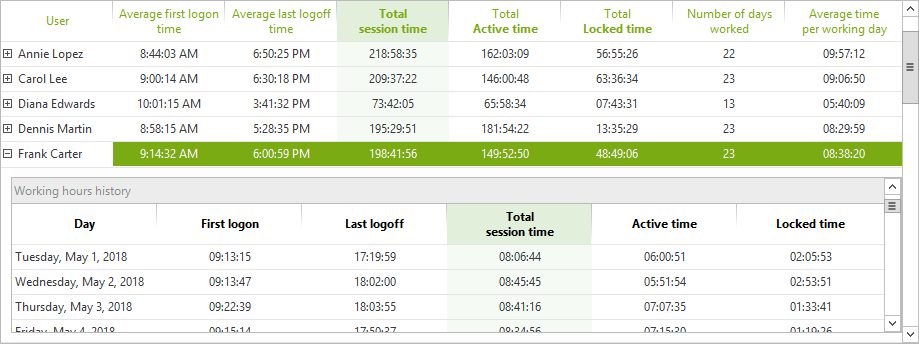
- A table displaying the statistics of the period for each user.
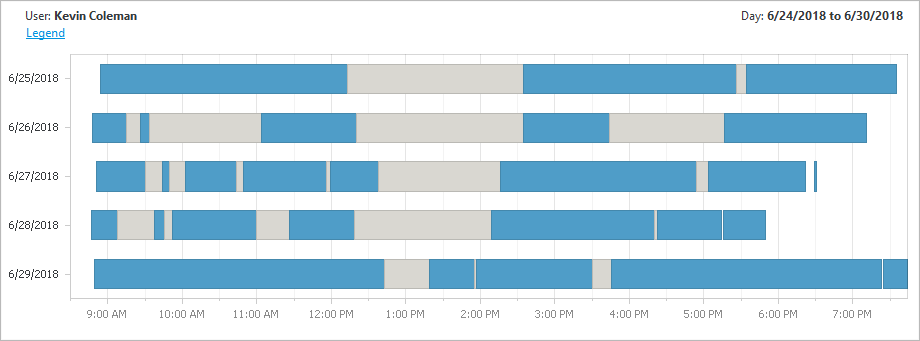
- A chart representing the different sessions of the user selected in the table above.
Main data table
The main table displays the following information:
- The name of the user
- Average first logon time: Average time a user first logged on (or unlocked) their session during the day.
- Average last logoff time: Average time a user last logged off (or locked) their session during the day.
- Total session time: Total time during which the user had at least one opened session (locked or active), between the first logon and the last logoff of the day.
- Active session time: Total time during which the user had at least one active session.
- Locked session time: Total time during which the user had only locked session(s) between the first logon and the last logoff.
- Number of days worked: Total number of days with at least one connection for a particular user.
- Average session time per day worked: Total session time divided by the number of days worked.
Note : Locked session times are counted between the first and the last connection of the same day. If a user locks their session at the end of the day instead of closing it, and unlocks the session the next day, that lockout time will not be counted.
IIS sessions are not available for these reports.
Breakdown of Hours
By clicking on the plus sign (+) next to the user name, you get the details of the hours worked for the week or month, with the following information:
- Day
- First logon time (first opening of a new session or first unlock)
- Last logoff time (closing the last session opened or last lock)
- Total session time
- Active session time
- Locked session time
Note : In the case of the monthly report, the breakdown of hours will be grouped for each week of the selected month.
Charts
Each report is accompanied by a graph.
Weekly graph
This graph shows the details of the hours worked for the selected user in the table. The days of the week with open sessions will be displayed on the vertical axis, and for each of these days, active session times will be displayed in blue and locked session times in grey. Time of the day will be displayed on the horizontal axis.
Monthly graph
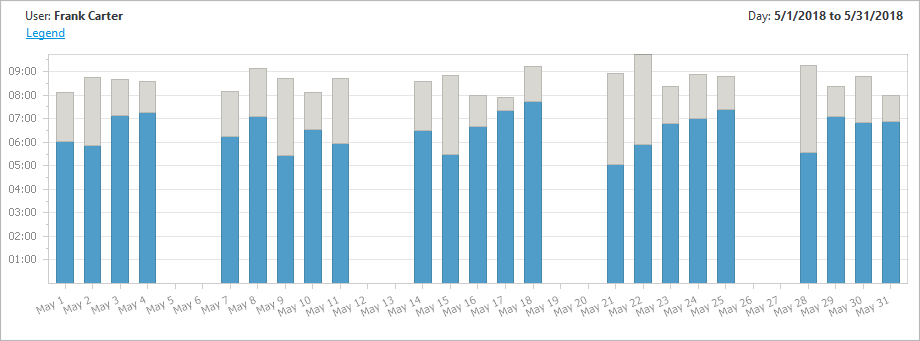
This graph displays the total number of hours worked for the selected user in the table. The days of the month will be displayed on the horizontal axis, and for each of these days the total number of hours of active session will be displayed in blue and the total number of hours of locked session in grey.
Filters
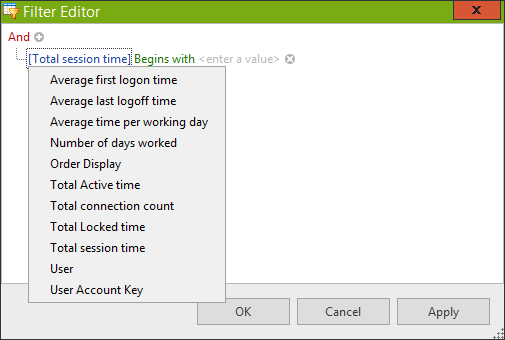
By clicking on the ‘Filters’ button, you will see a window allowing you to filter the results of the table. This allows you to quickly find users who do not meet certain criteria, without having to reload the report.

Summaries
The ‘Show Summaries’ button will display the totals or averages for each column in the main table and detail table. You can right-click on each summary to change the type:
- MIN : Minimum value of the column
- MAX : Maximum value of the column
- AVE : Average value of the column
- SUM : Sum of values in the column
- COUNT : Number of values in the column
Configuration 'section
- Week: Select the week you want to consult. By clicking on one of the days, it will automatically select the whole week.
Filter for the weekly report only.
- Month: Select the month you want to consult. This will automatically select the period from the 1st to the last day of the chosen month.
Filter for the monthly report only.
- Session Type: Select which type(s) of session(s) you want to include in the report. IIS sessions can’t be selected for this report.
- User: Filter the results for a specific user.
- Domain: Select only sessions for a particular domain.
'Group filter' section
For more information about the Group filters, please read the Common Report Filters page.
'Database' section
For more information about the Database filters, please read the Common Report Filters page.


