Dashboard
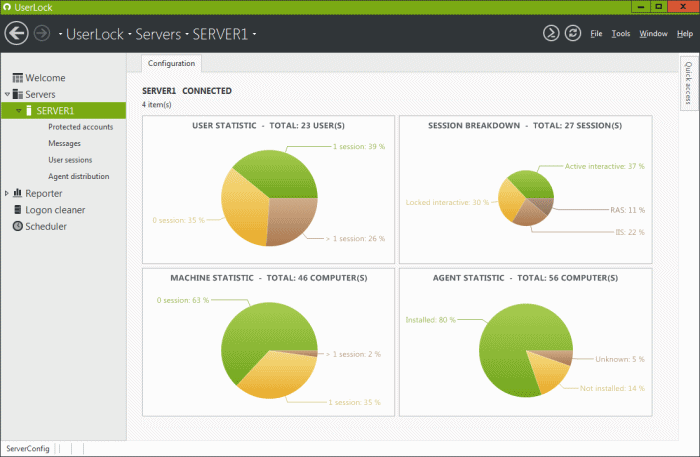
The 'Dashboard' view allows you to see the status of UserLock at a glance through four pie chat graphics. Select a server in the UserLock console to display its dashboard.
-
The 'User statistic' pie chart displays the number of users:
- With no session.
- With one session.
- With more than one session. -
The 'Session breakdown' pie chart displays the number of:
- Active interactive sessions.
- Locked interactive sessions.
- Wi-Fi/VPN sessions.
- Orphaned sessions (sessions on unreachable computers). -
The 'Machine statistic' pie chart displays the number of computers:
- With no session.
- With one session.
- With more than one session. -
The 'Agent statistic' pie chart displays the number of machines:
- With the agent installed.
- Without the agent installed.
- With the agent installing (waiting for reboot).
- With the agent uninstalling (waiting for reboot).
- With the agent upgrading (waiting for reboot).
- With an unknown agent status because the computer could not be reached by the process checking the 'agent status'.
Please note
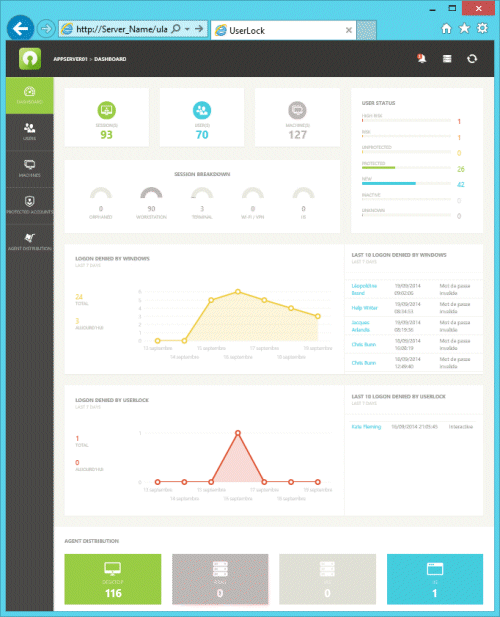
A dashboard with more details is available through the Web console.